We being a Data Analytics Company would love to share how AWS analytics tool Quick Sight uses Snowflake Warehouse.
Before getting started, let’s go for a briefing on AWS Quick Sight and a Snowflake Warehouse.
AWS Quick Sight is a cloud-based Business Intelligence service that is used to analyze data from your own data sources or AWS data sources to deliver insights by using a robust in-memory engine. QuickSight is used to create interactive dashboards and can be shared with others.
Snowflake is an analytic data warehouse that can be used as Software-as-a-Service(SAAS). Its unique data warehouse architecture can handle diverse data in a single system. It processes queries using massively large parallel processing computing power.
Procedure to connect Quick Sight to a snowflake.
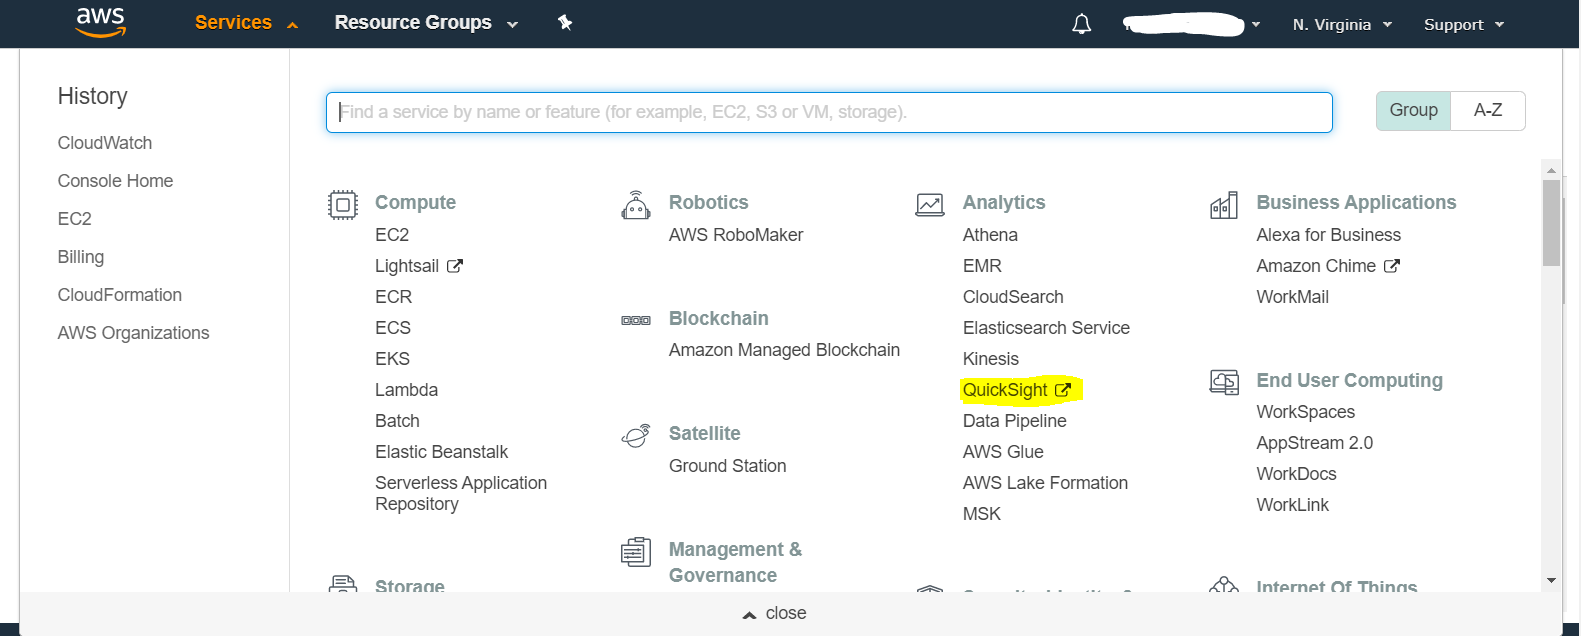
A) Login to your AWS console. You will find Services on the screen, click on it, where you find different services that have been provided by AWS. For us, we need Data Analytics services under which QuickSight is present.
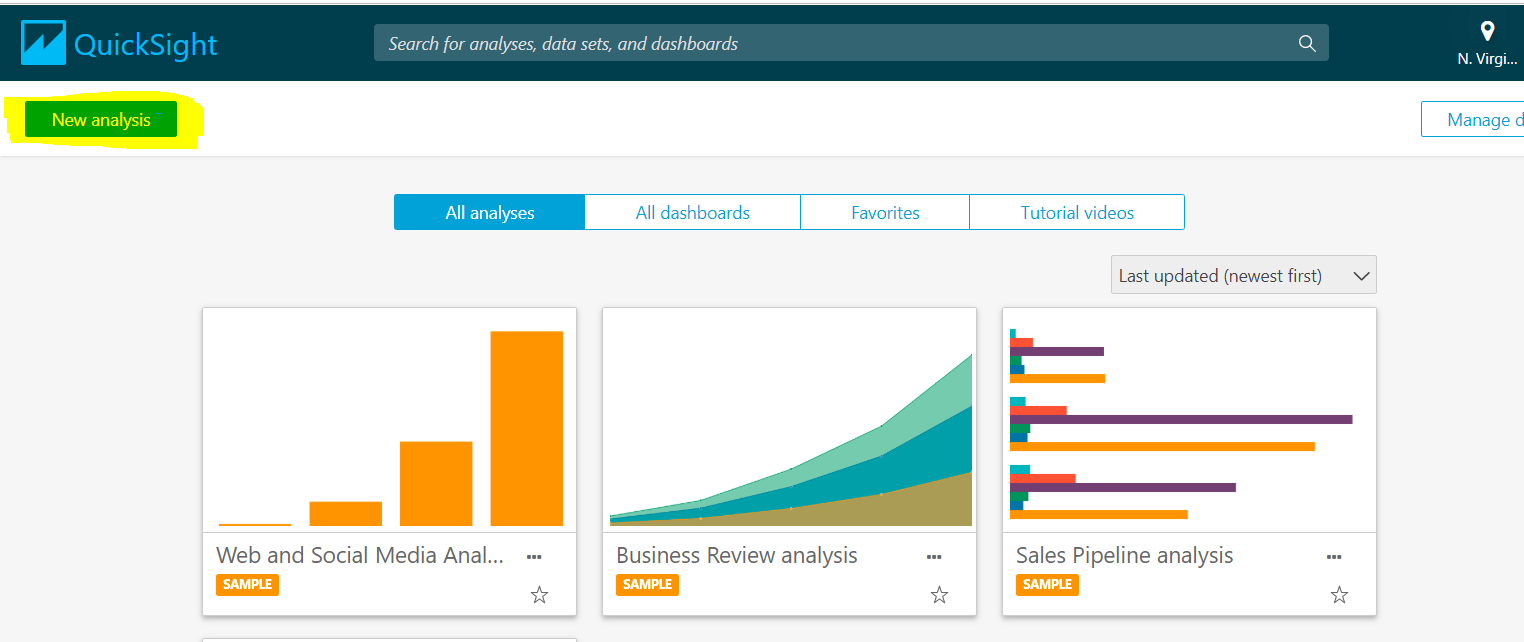
B) If you are a first time user, then you have to log in to QuickSight with your Account ID. Once it is done, QuickSight home page opens where you see different options like New Analysis, All Analyses. In case if you are confused about using the tool, go through the Tutorial videos for further assistance. To start a new report, click on New Analysis on the top left corner of the page.
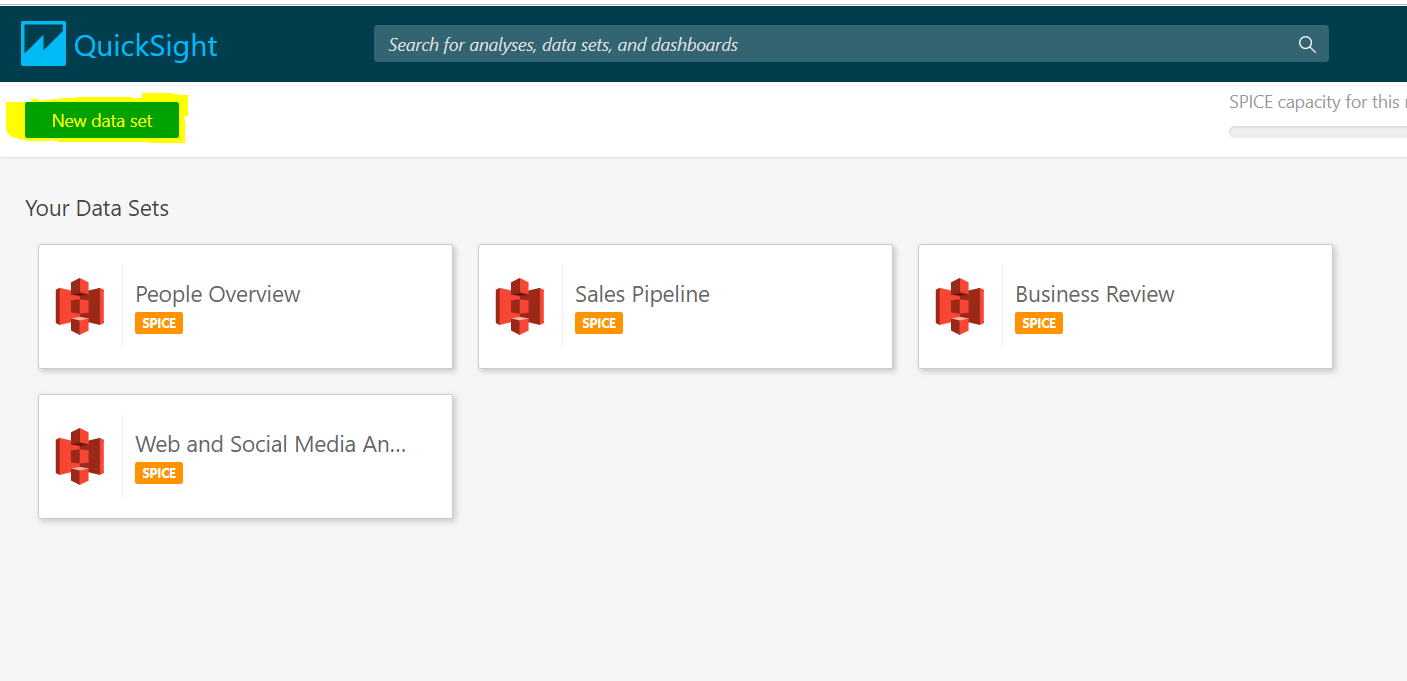
C) Now a new page appears in front of you where you can create a new data set. A data set is a collection of tables in databases or a file if you are connecting to Amazon S3, which is one of the data sources. A data set stores the raw data as well as the changes you have performed, such as renaming the field or changing its data type.
D) After clicking on Data sets, now you have to choose the data source from the existing data sources which you have created already or connect to a new data source which amazon has provided with different choices, such as
- A local file or Excel file using upload a file option.
- Salesforce – credentials must be provided.
- Amazon Redshift, Snowflake, Amazon RDS and other databases need to provide details for server, database hostname, and valid credentials for the connection.

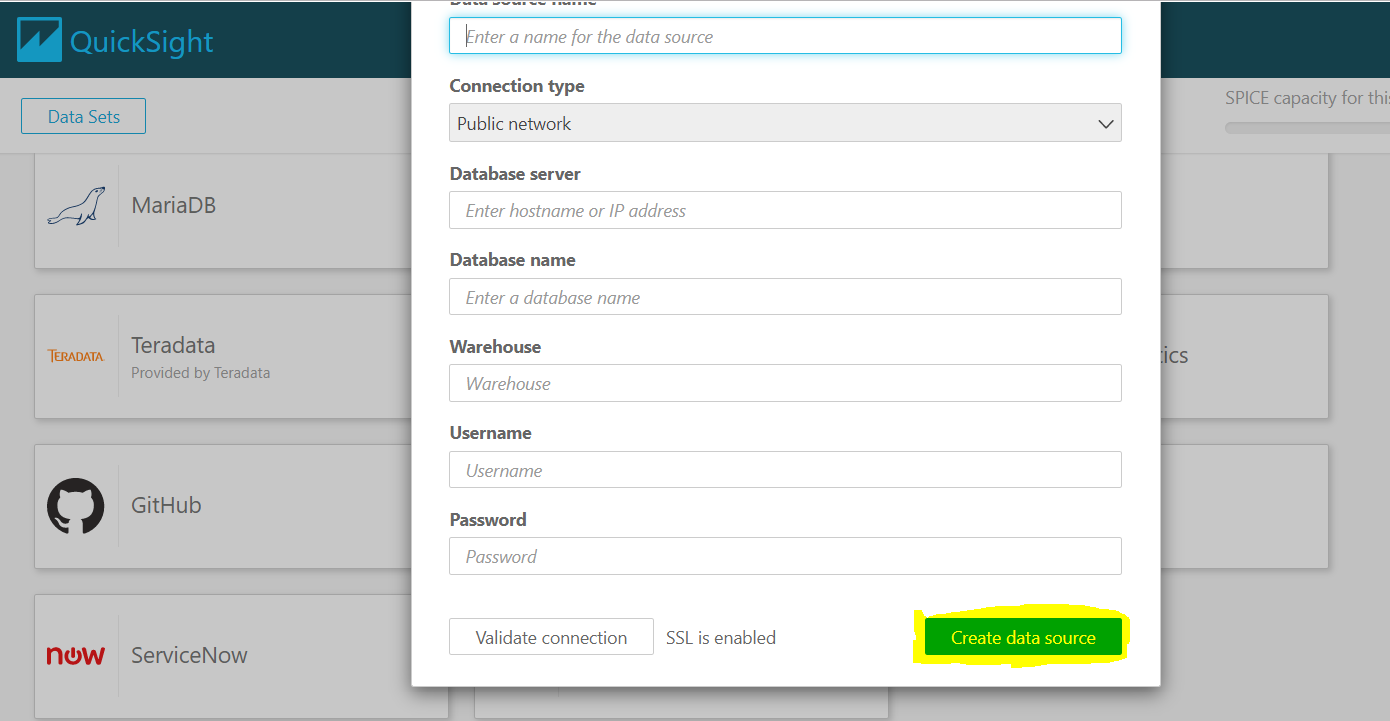
E) In this blog, we will connect to the data source Snowflake. For that, we have to provide database server, database name, warehouse name, username, and password. Then click on validate the connection to test the connection and once it is verified, then create a data source. Whatever credential is given are case sensitive.
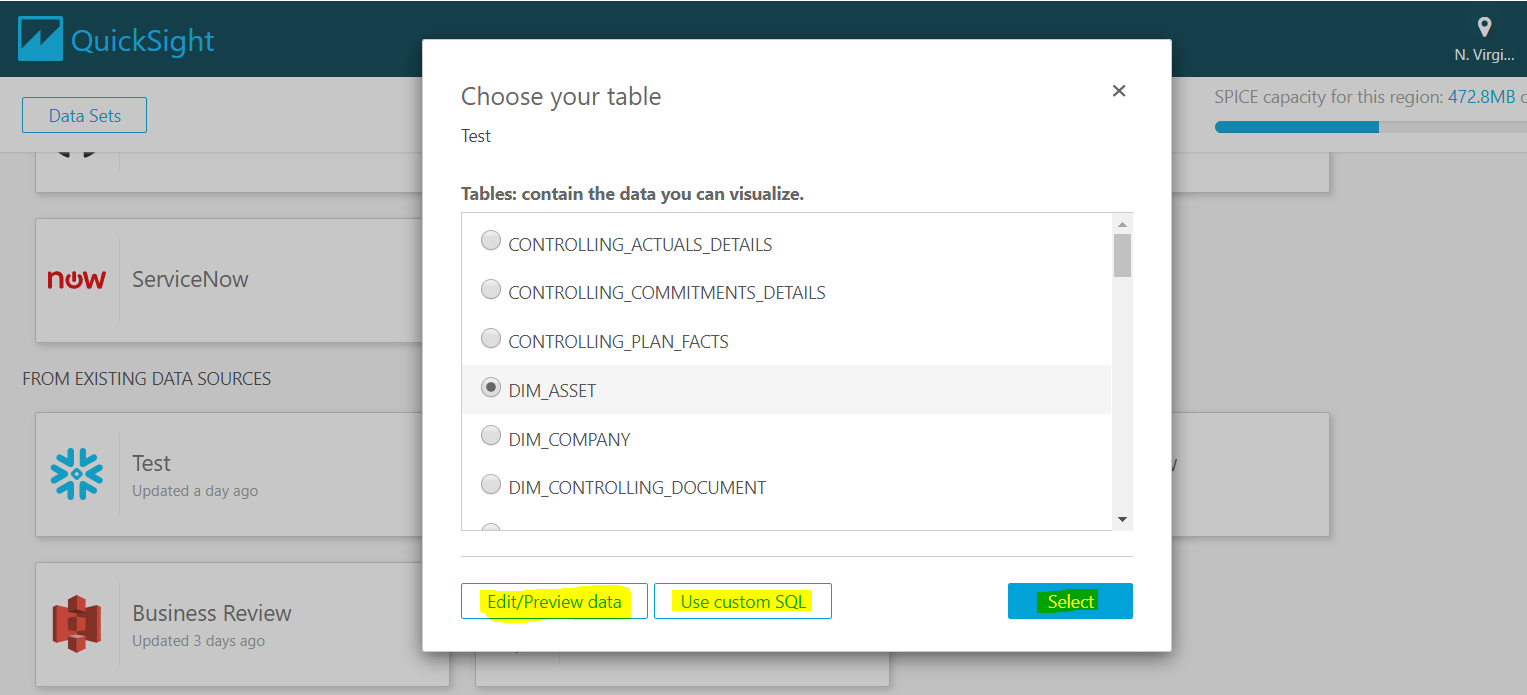
F) Once the validation is completed, then the connection has been set up to snowflake, here we have two ways to select a table
- Use Custom SQL or
- Choose a table from the list.
Writing a custom SQL query with Use custom SQL option, you can choose edit/preview data for data preparation or Choose Confirm query to validate SQL query without errors.
G) We can import data set into SPICE (Super-fast Parallel In-memory Calculation Engine). It is used for storage and processing capacity speeds up for analytical queries. By using SPICE we don’t have to retrieve the data every time from the database while doing the analysis because it imports the data into its storage.
A query is used to retrieve data directly from the database every time during the analysis which causes more time comparatively with SPICE.
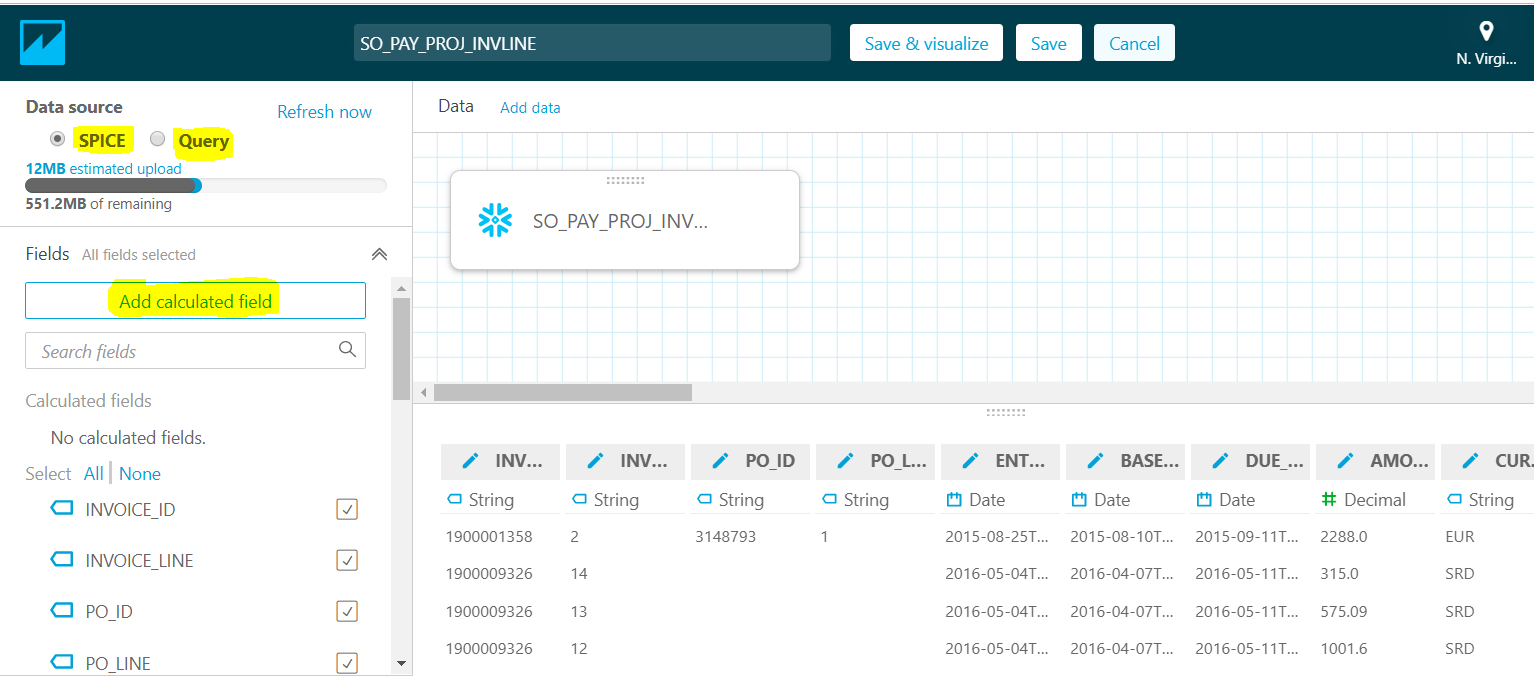
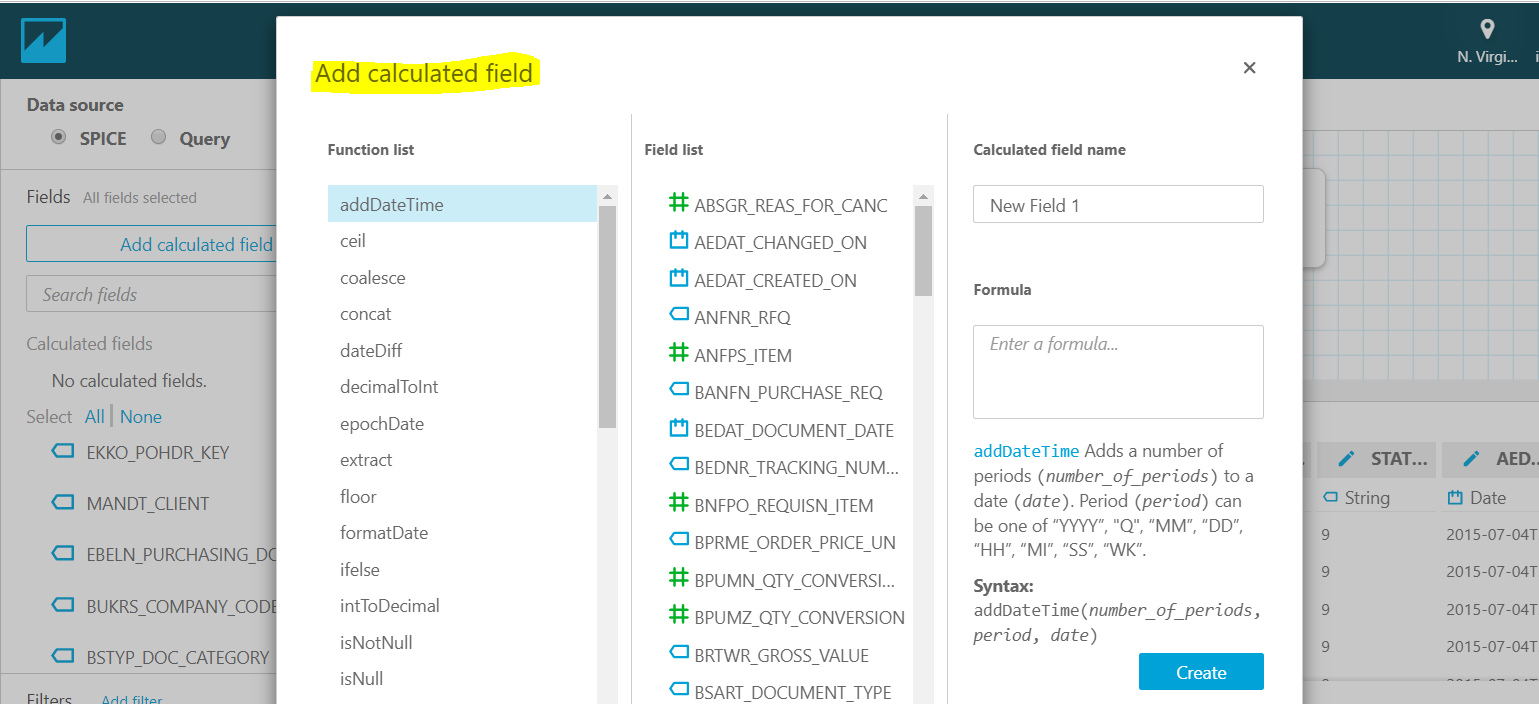
H) By using add calculate field, we can write a formula with aggregate function for analysis or transform field types like dataDiff, avg, add data time, etc. For further information refer to this link https://docs.aws.amazon.com/quicksight/latest/user/adding-a-calculated-field-analysis.html
I) If we have a requirement for data analytics where we have to use more then one table, in those scenarios by using Add Data we can add a new table to the data source, and we can configure the joins between the tables.

J) QuickSight Visuals is a graphical representation of the data by using different visual types like a pie chart, bar chart, line chart, maps, etc. We can also apply filters for both regular or calculated fields of the visual data. QuickSight filters are also used to exclude a visual element representing a particular value. The story option is used when we have to show two different charts with different filters in a single report. We can access the dashboard by using parameters.
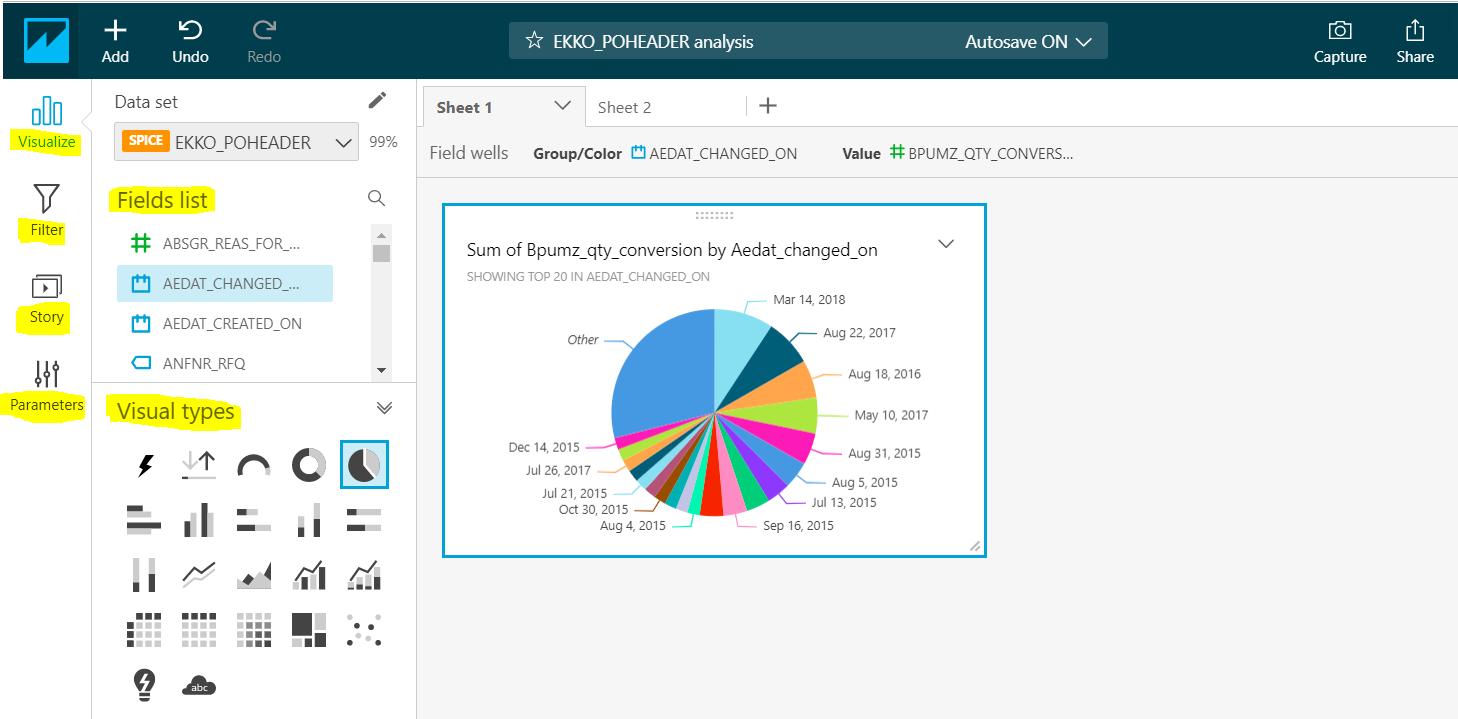
K) We can create and publish a dashboard analysis made from the data sources for the business requirement. Viewing and filtering the dashboard without changing the underlying data can be done by the authorized person.


Leave A Comment